In this lesson we will build on what we created in the previous lesson. The survey will be extended by adding the
following:
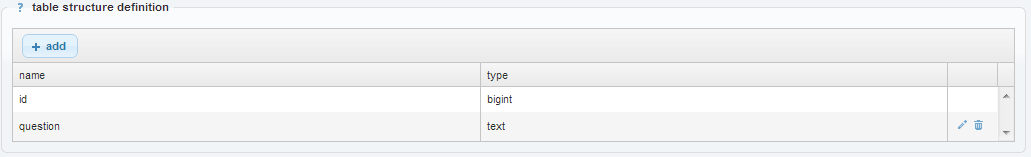
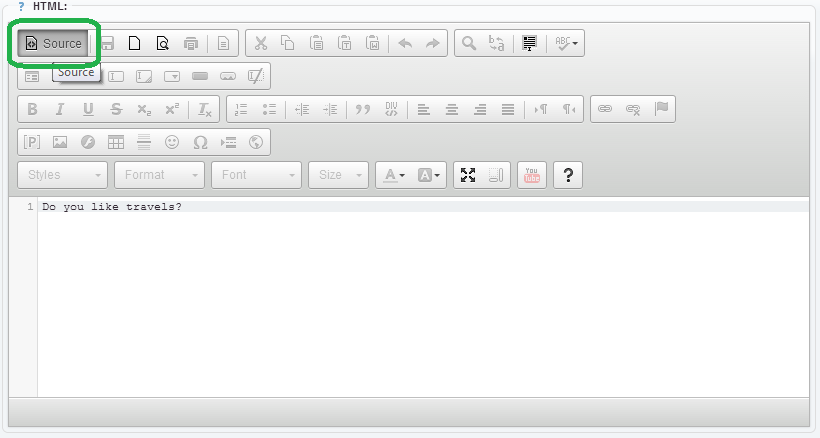
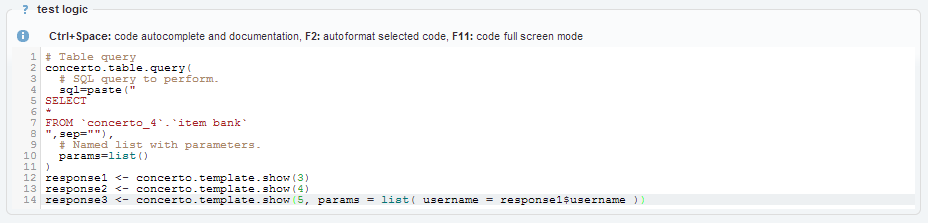
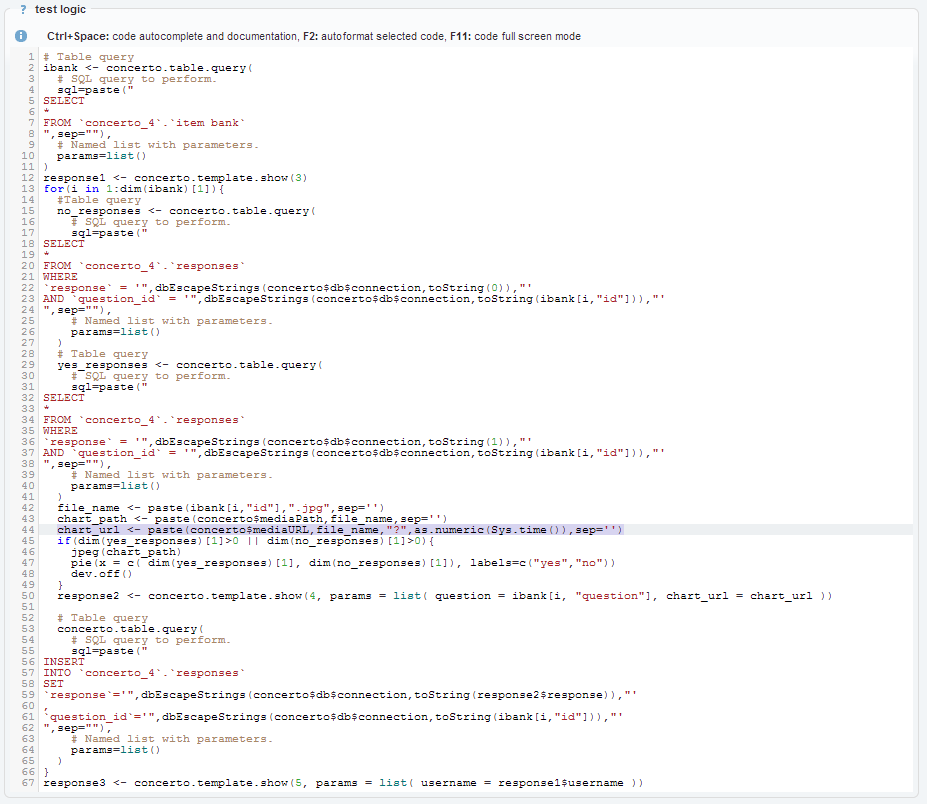
Open the previously created test named survey. The test logic should look like this:
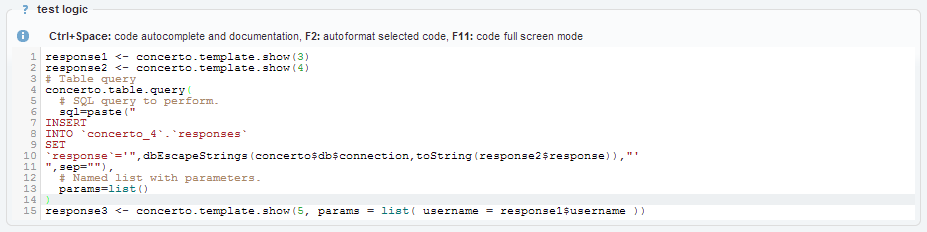
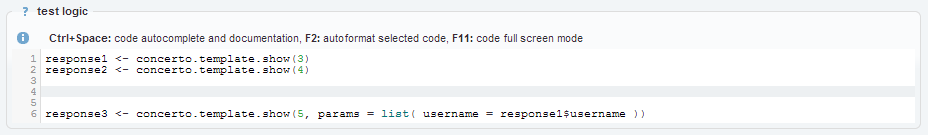
Remove previously created table insert query. The test logic should now look like this:
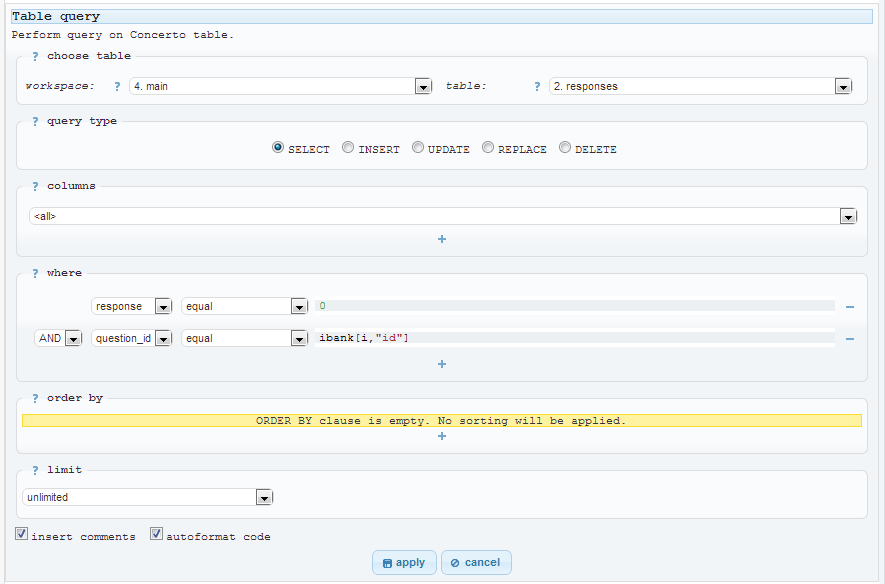
At the beginning of the test logic insert concerto.table.query function wizard
to read the whole item bank. The configured function wizard should look like this (ids can be
different):
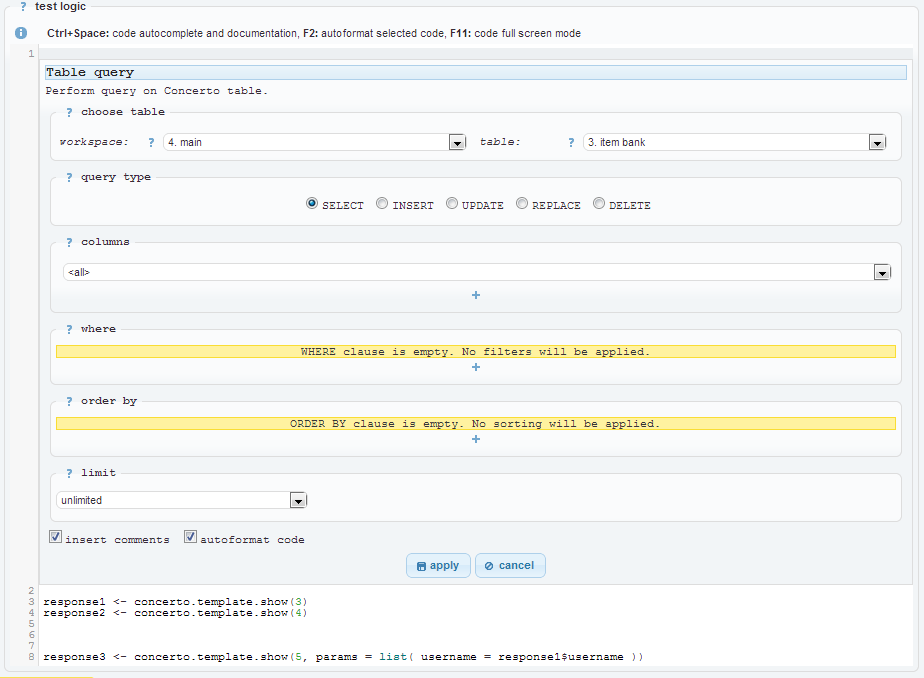
Apply the function wizard by clicking apply button
The code should now look like this (exact query string can differ):
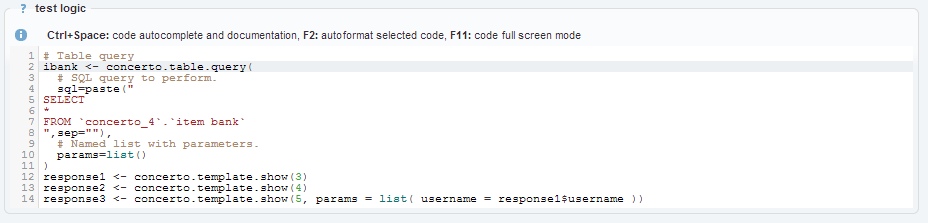
Now assign the output of the table query (data frame with every item in item bank) to the variable named
ibank:
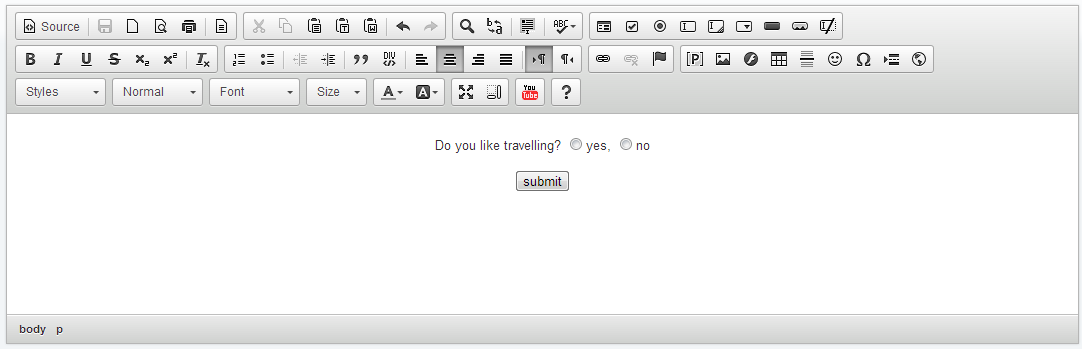
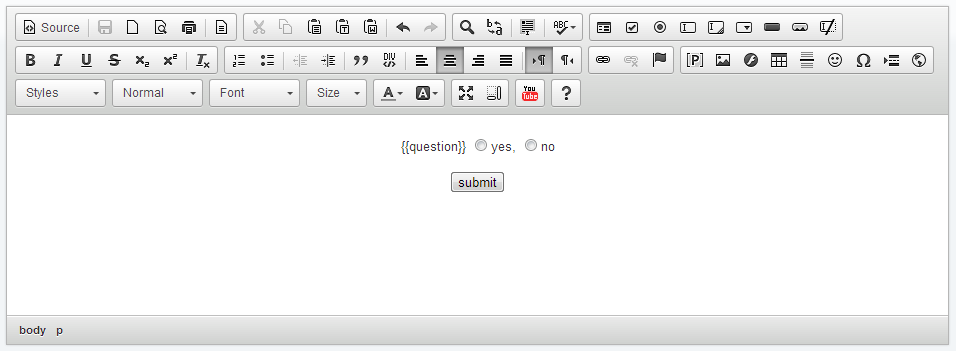
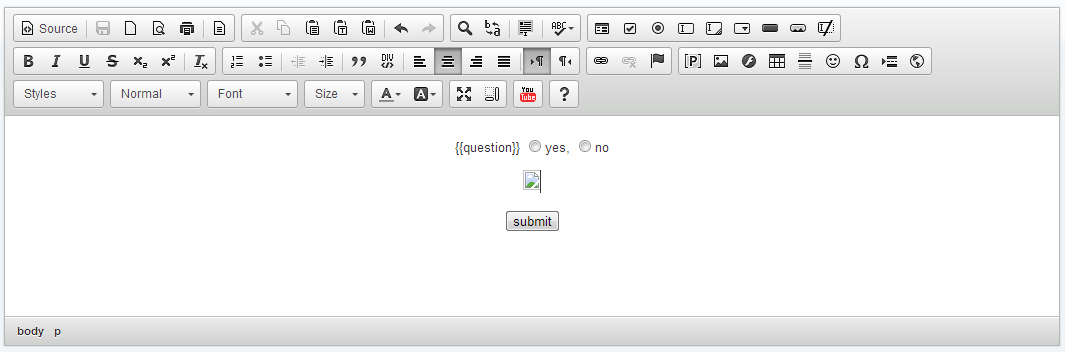
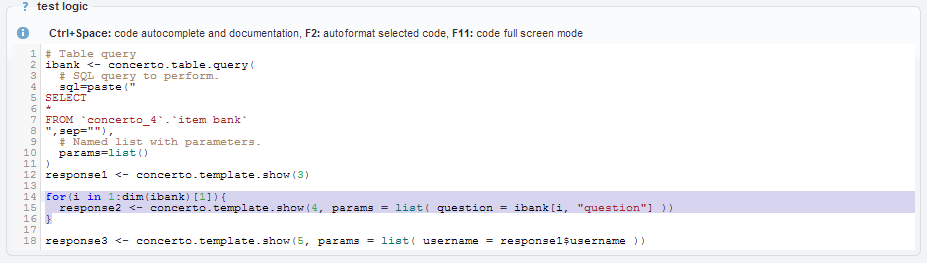
Now add a loop to iterate through every item in item bank and show the survey template for
each of the question. We will also show items question column value in a template:
At the top of the looped block add concerto.table.query function wizard and set
it so that you can retrieve all "no" answers for current question. Assign the output
of the applied function wizard to variable named no_responses
The code should now look like this:
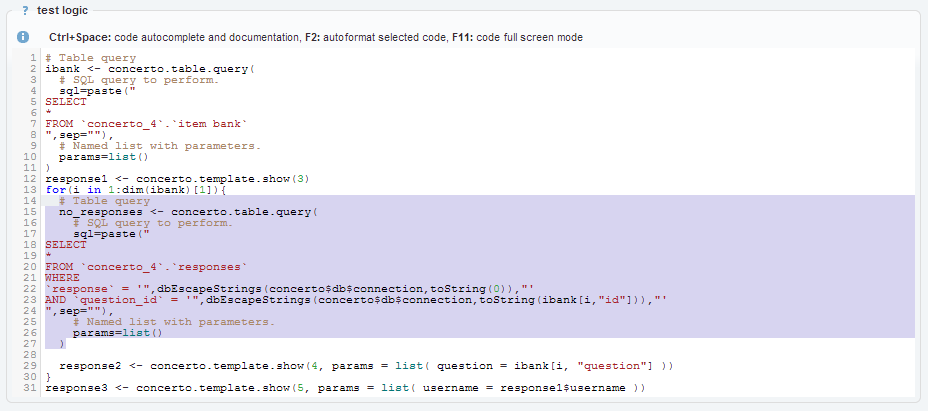
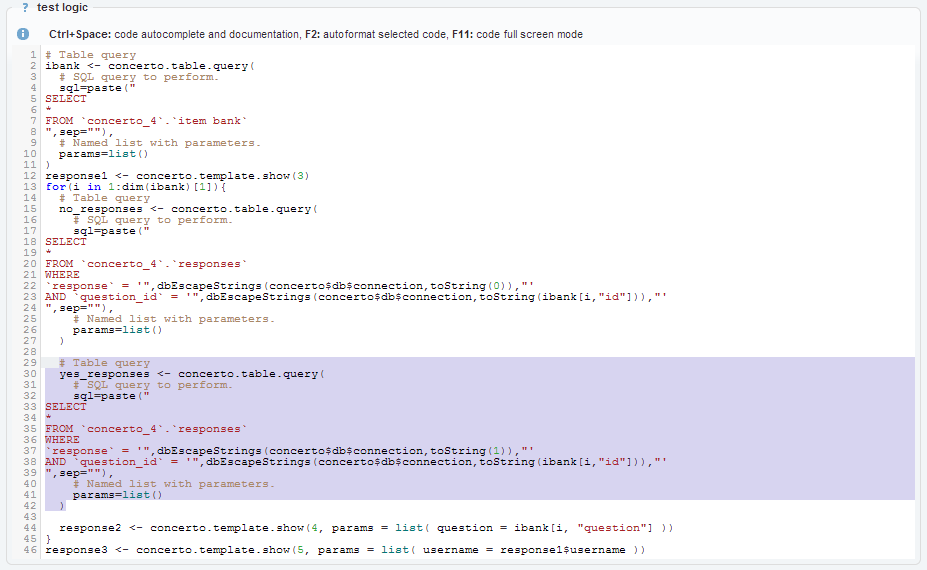
Below that do the same for yes answers and assign the output to variable: yes_responses
(yes responses are represented in the response table by 1):
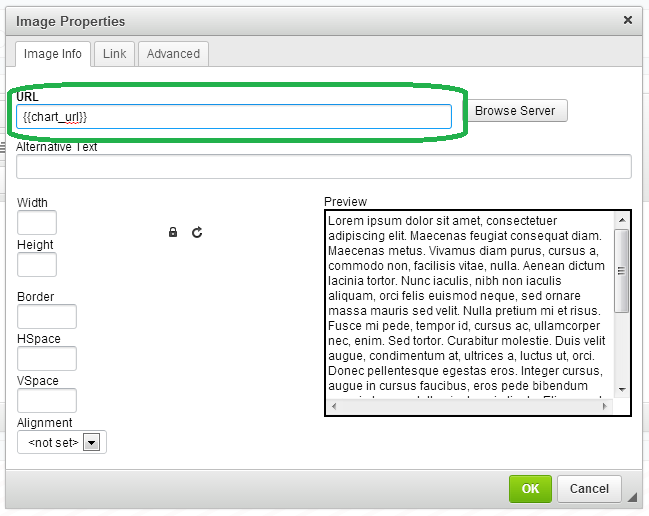
Now we need to declare variables for chart path and full URL. We will use three variables for that:
file_name - chart file name, chart_path - chart path
used to save the chart, chart_url - chart URL used by HTML template to show the
chart image. Two additionals variables are used here: concerto$mediaPath - test
owner media directory path (used for media saving and internal file operations),
concerto$mediaURL - URL of the previous directory used (used on HTML
templates)
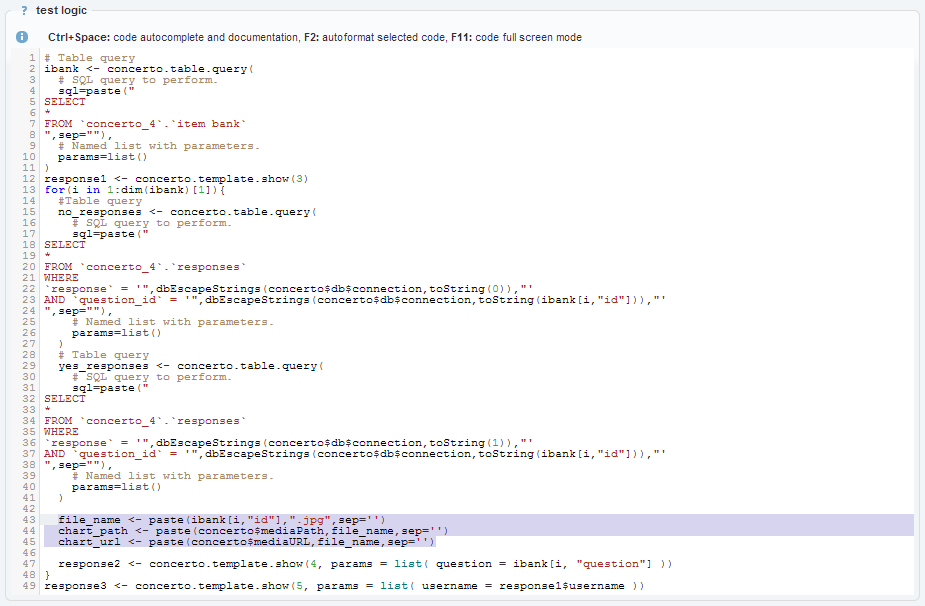
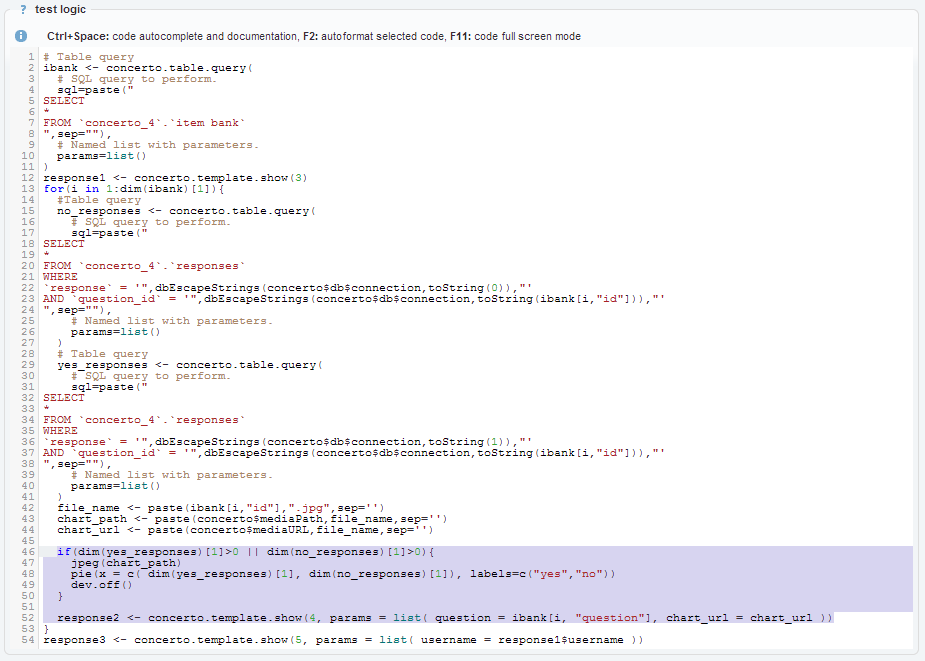
Here is the code responsible for creating chart and showing it on HTML template. Please not that we pass one
more variable to HTML template: chart_url
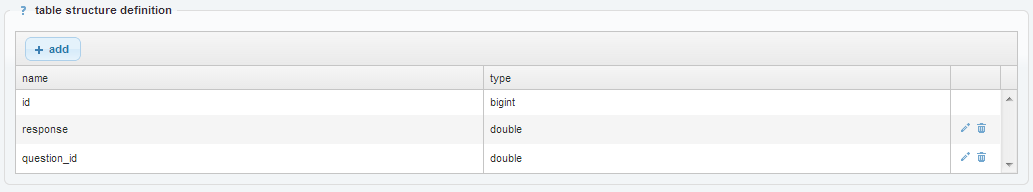
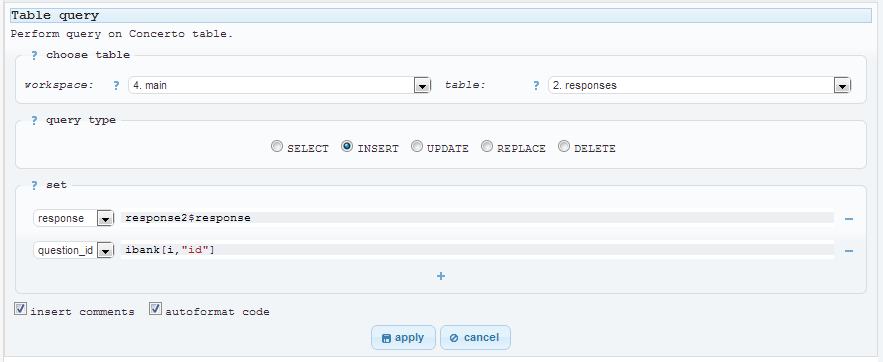
Now all that is left is to insert the response to the response table. Insert concerto.table.query
function wizard right after the code to show the template in looped block and set it like that:
There is one more thing that we can add. To prevent chart image caching in browser we could append unique
string (taken from current system time) to the chart URL:
Save the test